Numbers settle arguments that opinion cannot. After more than a decade of testing older machines - everything from 2009 netbooks with spinning drives to 2017 business laptops with NVMe slots - I have learned that the single most misleading metric in PC performance is the one people fixate on first: boot time to the desktop. It looks simple, feels objective, and hides at least three variables that change the result dramatically depending on how you measure. This section lays out what I actually measure, how the tests are structured, and why the numbers come out the way they do. If you are looking for step-by-step fixes based on these results, the guides section translates the data into practical walkthroughs for each hardware scenario.
Below you will find cold boot versus warm boot methodology, the storage and software factors that dominate timing results, benchmark strips from common hardware configurations, and comparison cards that match the test machines used across the site. Every number published here is the median of five consecutive runs on the same hardware with the same configuration - no cherry-picked best case, no rounding to look impressive.
A stopwatch from power button to desktop wallpaper tells you one thing: how long it took to reach a screen with icons on it. It does not tell you whether the machine is actually usable at that point. On a lot of older hardware - particularly machines with 4 GB of RAM and a mechanical hard drive - the desktop appears but the system spends another thirty to ninety seconds loading background services, indexing files, and fighting for disk I/O before you can reliably open a browser or file manager. That post-login delay is invisible to most timing methods but very visible to anyone sitting in front of the machine waiting.
I time two things separately: time to desktop (TTD) and time to interactive (TTI). TTD is the moment the desktop environment finishes rendering. TTI is the moment I can open a browser and begin loading a page without the system stalling or the cursor freezing. On a machine with an SSD and a lightweight Linux distro, those two numbers are usually within a second of each other. On a machine with a 5400 RPM hard drive and Windows 10 with default startup programs, the gap can be over a minute. That gap is where most user frustration lives, and it is the gap these benchmarks are designed to expose.
A cold boot starts from a full power-off state - no power to RAM, no suspend image, no fast startup cache. The firmware initialises the hardware from scratch, runs POST, hands off to the bootloader, and the operating system loads everything into memory from storage. This is the slowest and most revealing test because it exposes every bottleneck in the chain: slow firmware initialisation, a hard drive that needs spin-up time, a bloated startup sequence, and an operating system that loads more than the hardware can handle comfortably.
A warm boot - which includes Windows fast startup, suspend-to-disk, and resume-from- hibernate scenarios - skips some or all of that chain by reloading a saved memory image. The numbers look much better, but they mask the real condition of the system. A machine that cold boots in 90 seconds and warm boots in 15 seconds has not become faster - it has just skipped the part where you would notice how slow it is. I publish cold boot numbers as the primary metric because they reflect what happens after a power cut, a BIOS update, a kernel update, or any other event that forces a full restart. Warm boot figures are noted where relevant but never used as the headline number.
Two machines with identical CPUs and RAM can boot 50 seconds apart if one has an SSD and the other has a mechanical drive. The storage medium is the single biggest variable in boot time, and it is not close. A 5400 RPM hard drive delivers around 80 to 100 MB/s sequential read in good condition - but boot is not sequential. The operating system reads thousands of small files scattered across the disk, and random read performance on a spinning drive drops to 0.5 to 1.5 MB/s. An SSD handles those same random reads at 20 to 40 MB/s. That difference alone accounts for the majority of the boot time gap on most older machines.
Software bloat is the second factor, and it compounds the storage problem. A fresh Windows 10 install loads a handful of services at startup. After two years of updates, manufacturer utilities, browser helpers, and driver updaters, that list can triple. Each service reads files from disk, and on a mechanical drive each read competes for the same head position. The result is a cascading queue of small I/O operations that makes every individual service slower to load than it would be in isolation. An SSD reduces the per-read penalty, but cutting unnecessary startup entries reduces the total number of reads - both changes help, and they stack.
For a deeper look at what separates a storage-bound machine from a software-bound one, see the dedicated comparison:
- What really slows an old laptop down - A breakdown of the specific bottlenecks by hardware generation, with test data showing where the time actually goes during a cold boot sequence.
Median of five cold boot runs per configuration - 2012 to 2016 test hardware
The pattern across every test configuration is consistent: storage type dominates, operating system weight is second, and startup software load is third. If you only make one change to an older machine, replace the mechanical drive. If you make two, replace the drive and trim or replace the operating system. The SSD-plus-lightweight- Linux combination consistently delivers cold boot to interactive under 15 seconds on hardware from 2012 onward - which is faster than most new budget laptops ship out of the box.
These benchmarks are from a controlled set of test machines, not a survey. Your specific hardware will produce different absolute numbers, but the relative improvements hold. A machine that cold boots in 90 seconds on a mechanical drive will not drop to exactly 19 seconds with an SSD, but it will drop by roughly the same percentage. The ratios are what matter, not the exact figures.
Deep dives into specific comparisons
Cold Boot vs Warm Boot Explained
A detailed walkthrough of what happens during each boot type, why the numbers differ so dramatically, and when warm boot figures are useful versus when they are misleading. Includes a side-by-side timing breakdown showing where each second goes in both scenarios on the same hardware.
Read the comparisonWhat Really Slows an Old Laptop Down
Boot time is the symptom, but the cause varies by hardware generation. This comparison isolates the specific bottlenecks - storage throughput, RAM contention, firmware initialisation time, and startup program load - and shows which factor dominates on each class of machine. Includes test data from Celeron, Core i3, and Core i5 systems spanning 2011 to 2016.
Read the comparisonUpdated test results for 2026 covering newer OS versions, RAM limits, sleep-wake reliability, and storage generation comparisons on the same bench hardware.
Sleep, Wake, and Battery Drain: One-Week Reliability Benchmarks on Refurb Laptops
One-week reliability benchmarks testing sleep, wake, and battery drain behaviour on refurbished laptops running Windows 10, Windows 11, and Linux Mint. Covers wake failure rates, overnight battery drain percentages, suspend-resume cycle reliability, and the specific ACPI and driver issues that cause problems on older hardware. Includes model-specific notes for common refurbished business laptops and practical configuration fixes that improve reliability.
Read the benchmark4GB RAM Reality Test 2026: Browser Tabs, Video Playback, and Swap Behaviour on Windows vs Linux
Tests the practical limits of 4GB RAM in 2026 across Windows 10, Windows 11, and Linux Mint. Measures maximum usable browser tabs before swap thrashing, video playback performance under memory pressure, and the real-world impact of swap on responsiveness. Shows where 4GB remains workable and where it becomes a genuine barrier. Includes specific configuration recommendations for getting the most out of memory-constrained machines.
Read the benchmarkWindows 10 ESU vs Windows 11 25H2 vs Lightweight Linux: Idle RAM, Background CPU, and Boot Time Compared
A controlled benchmark comparing Windows 10 with ESU, Windows 11 25H2, and Linux Mint XFCE on the same older hardware. Measures idle RAM consumption, background CPU usage, cold boot time, and time-to-usable-desktop. Tests conducted on three representative laptop generations. Results show meaningful differences in resource overhead that directly affect usability on 4-8GB machines. Includes practical recommendations based on hardware capabilities.
Read the benchmark2026 Boot Time Index: HDD vs SATA SSD vs NVMe Across Common Laptop Generations
A comprehensive 2026 boot time benchmark comparing hard drives, SATA SSDs, and NVMe drives across common laptop generations from 2012 to 2020. Tests Windows 10, Windows 11 25H2, and Linux Mint on the same hardware to isolate the storage variable. Includes cold boot, warm boot, and time-to-usable-desktop measurements with full methodology notes. Shows that the HDD-to-SSD jump remains the single biggest performance improvement available on most older laptops.
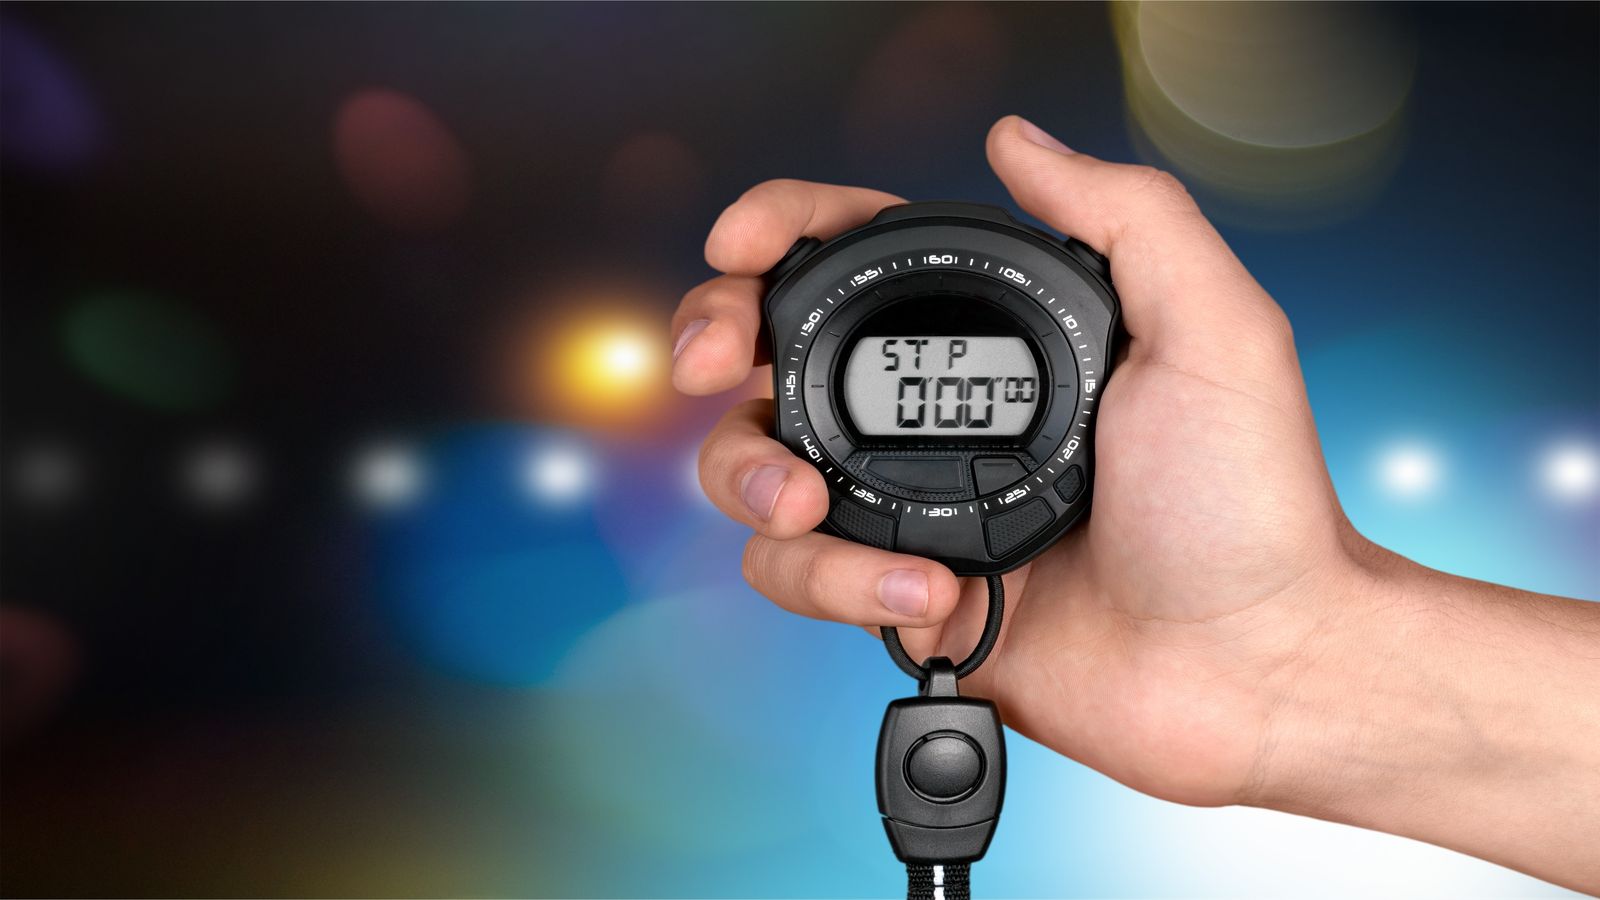
Read the benchmarkEvery measurement follows the same protocol. The machine is powered off completely - not suspended, not hibernated, not using Windows fast startup. Power is disconnected for at least 10 seconds to ensure RAM is cleared. The stopwatch starts when the power button is pressed. TTD is recorded when the desktop background and panel are fully rendered. TTI is recorded when a browser window opens and begins loading a local HTML file without the cursor freezing or the system stalling.
Five consecutive cold boot runs are performed per configuration with no changes between runs. The median value is published. Outliers - usually the first boot after an OS install or update - are noted but excluded from the median. All machines are tested on the same power strip with the same peripherals disconnected. The goal is consistency, not perfection. Real-world numbers will vary based on peripheral load, ambient temperature, and drive age, but the relative comparisons hold.
Test conditions checklist
- Windows fast startup and hybrid shutdown disabled
- Full power-off between each run, 10-second drain
- No external peripherals connected during timing
- Five runs per configuration, median reported
- TTD and TTI recorded separately for every run
- Wi-Fi connected but no background sync during timing
- Same BIOS firmware version maintained per machine across all tests
Every number on this page comes from physical hardware on the workbench - the same machines used in the guides and support documentation across this site. I do not publish synthetic scores, manufacturer claims, or numbers from virtual machines. When the results change - because a new kernel version shifts boot timing or a firmware update affects POST speed - the benchmarks get updated with the new data and the previous figures are noted for reference. The point is not to sell a particular OS or upgrade path. The point is to give you reliable data so you can make the right call for the hardware sitting in front of you.